Life Cycle Emissions: Sustainable vs. Conventional Vehicles
The journey of a vehicle, from its raw materials to the scrapyard, carries an environmental footprint far beyond what comes out of its tailpipe. In New Zealand, as we pivot towards a more sustainable lifestyle, understanding the full life cycle emissions of our transport choices becomes paramount. It’s not just about what we burn, but what we build and how we dispose.
This comprehensive guide will unpack the complex emissions profiles of both conventional internal combustion engine (ICE) vehicles and their sustainable counterparts, primarily electric vehicles (EVs). We’ll look beyond the surface to reveal the true environmental cost and benefit, helping you make informed decisions for a greener Aotearoa.
1. Understanding Life Cycle Emissions (LCE)
Life Cycle Emissions (LCE), also known as ‘well-to-wheel’ or ‘cradle-to-grave’ emissions, account for all greenhouse gas (GHG) emissions associated with a product throughout its entire existence. For a vehicle, this encompasses four main stages:
- Manufacturing: Emissions from raw material extraction, processing, component production, and vehicle assembly.
- Use Phase: Emissions from fuel/electricity production (well-to-tank) and vehicle operation (tank-to-wheel/plug-to-wheel). This is often the largest component for conventional vehicles.
- Maintenance & Infrastructure: Emissions related to replacement parts, repairs, and the infrastructure supporting vehicle use (roads, charging stations).
- End-of-Life: Emissions from dismantling, recycling, and disposal of vehicle components.
“Focusing solely on tailpipe emissions provides an incomplete and often misleading picture of a vehicle’s true environmental impact. A holistic LCE approach is essential for accurate sustainability assessment.”
Global Stat Callout:
Transportation accounts for approximately 25% of global energy-related CO2 emissions, with road transport being the dominant contributor. Understanding LCE helps identify reduction opportunities across the entire value chain, not just during driving.
2. Conventional Vehicles: A Closer Look
Conventional vehicles, powered by internal combustion engines (ICE), have a well-understood emissions profile. While tailpipe emissions of CO2 are a primary concern, the ‘upstream’ and ‘downstream’ impacts are significant.
Manufacturing Footprint
The production of ICE vehicles involves substantial energy and material input. This includes mining and processing metals like steel and aluminum, manufacturing plastics, rubber, and glass, and the energy-intensive assembly processes. While generally lower than an EV’s initial manufacturing footprint, it’s still considerable.
Use Phase: The Dominant Factor
The vast majority of an ICE vehicle’s LCE comes from burning fossil fuels during its operational lifetime. This includes:
- Fuel Extraction & Refining: Energy used to find, drill, transport, and refine crude oil into petrol or diesel. This ‘well-to-tank’ portion contributes significantly.
- Combustion: The ‘tank-to-wheel’ emission of CO2, nitrogen oxides (NOx), particulate matter (PM), and other pollutants directly from the exhaust.
End-of-Life Considerations
While some parts of conventional cars are recycled (metals), many components end up in landfills. The disposal of hazardous fluids and non-recyclable plastics still presents environmental challenges.
3. Sustainable Vehicles: Deconstructing the ‘Green’ Claim
When we talk about ‘sustainable’ vehicles, we primarily refer to Electric Vehicles (EVs), including Battery Electric Vehicles (BEVs) and Plug-in Hybrid Electric Vehicles (PHEVs). These vehicles shift the emissions profile, but they are not entirely emission-free.
Manufacturing: The Upfront Investment
EVs generally have a higher upfront manufacturing footprint compared to ICE vehicles. This is largely due to the production of their battery packs, which require significant energy and often involve materials like lithium, cobalt, and nickel. Extraction and processing of these materials contribute to initial emissions. However, advancements in battery technology and cleaner manufacturing processes are steadily reducing this impact.
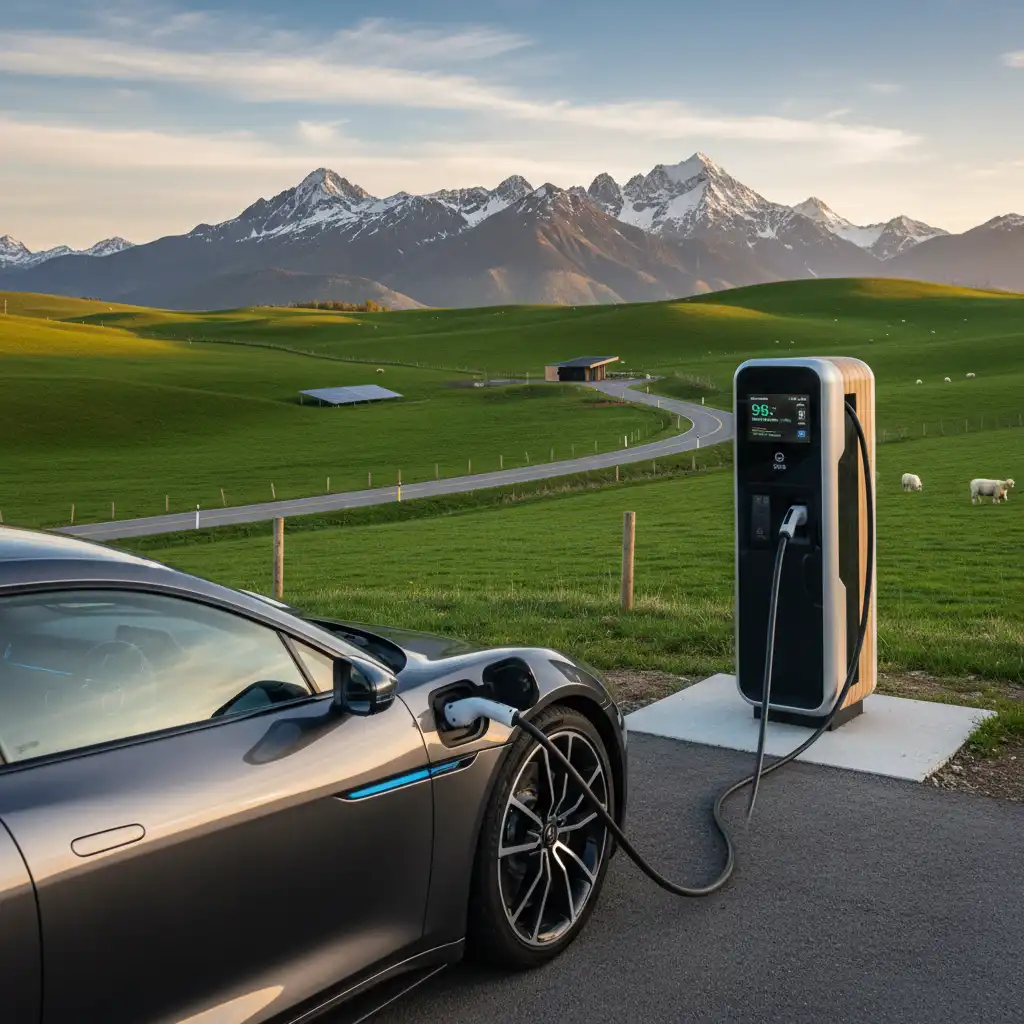
Use Phase: The Grid is Green for EVs in NZ
This is where EVs shine, particularly in countries with a high proportion of renewable energy in their grid, like New Zealand. While EVs have zero tailpipe emissions, their LCE during the use phase depends entirely on how the electricity they consume is generated.
- New Zealand’s Advantage: Over 80% of New Zealand’s electricity comes from renewable sources (hydro, geothermal, wind). This means the ‘well-to-wheel’ emissions for an EV charged in NZ are significantly lower than in countries heavily reliant on coal or gas for power generation.
- Plug-in Hybrids (PHEVs): Offer a transition, combining an electric motor with a petrol engine. Their LCE varies greatly depending on how often they are charged and driven on electric power.
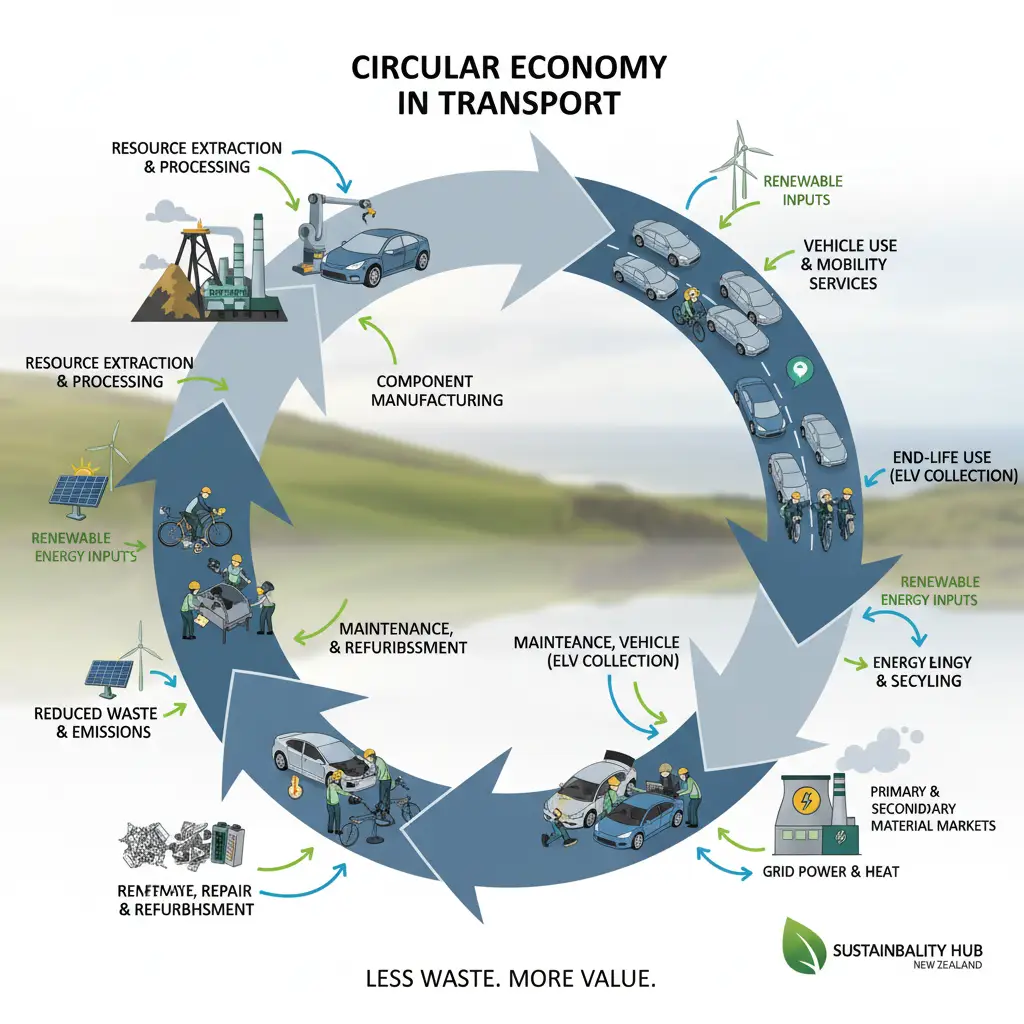
End-of-Life: The Battery Challenge and Opportunity
The biggest end-of-life consideration for EVs is their battery packs. While historically a challenge, significant progress is being made in battery recycling and repurposing (e.g., for grid-scale energy storage). This allows valuable materials to be recovered and reduces waste, improving the overall LCE profile.
4. The Emissions Comparison: Where Do They Stand?
Comparing the LCE of conventional and sustainable vehicles reveals a clear trend, but also nuances that are crucial to understand. The key is to look at the total emissions over the vehicle’s entire lifespan, typically 150,000 to 200,000 kilometers.
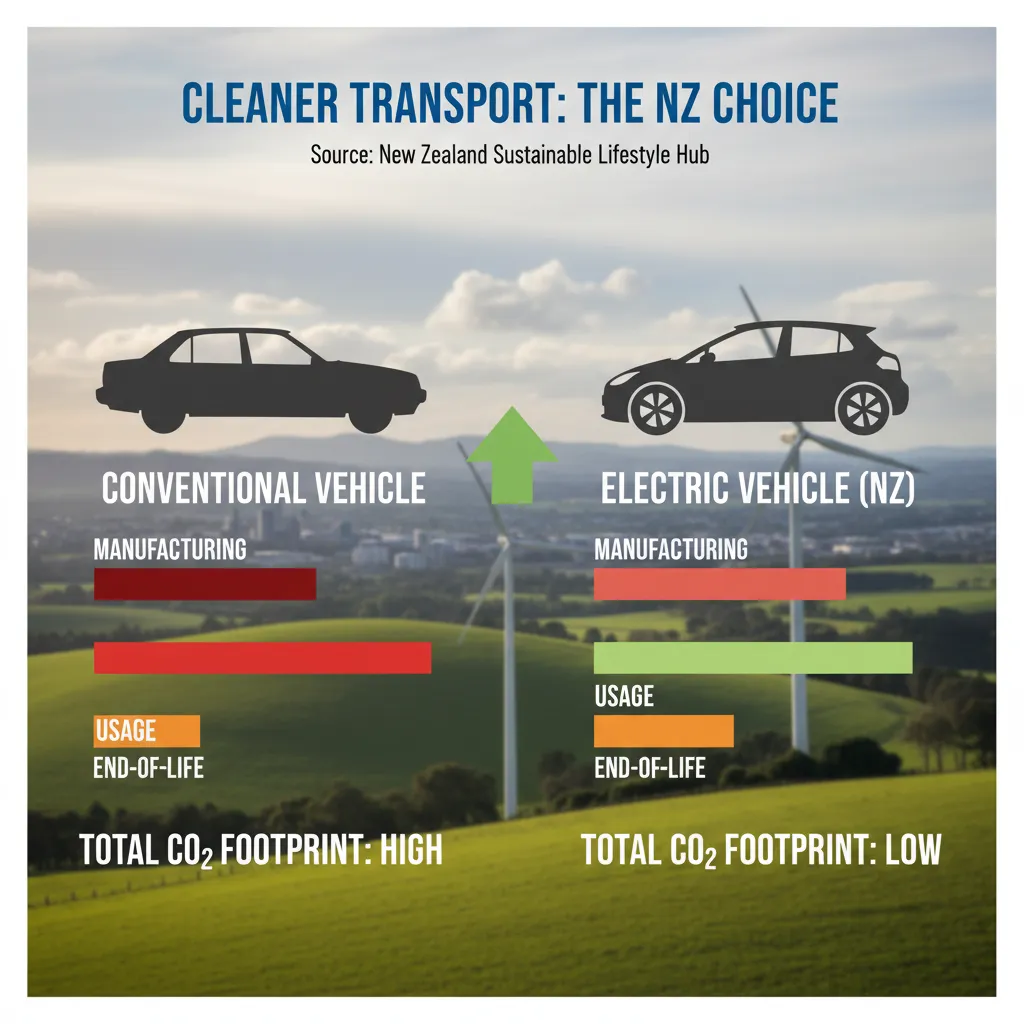
Life Cycle Emissions Comparison Table (Illustrative CO2e per km)
| Emission Stage | Conventional ICE Vehicle | Electric Vehicle (NZ Grid) |
|---|---|---|
| Manufacturing (incl. battery for EV) | ~50-70 g CO2e/km | ~70-120 g CO2e/km (higher due to battery) |
| Use Phase (Fuel/Electricity) | ~150-250 g CO2e/km | ~15-30 g CO2e/km (NZ grid average) |
| End-of-Life & Recycling | ~5-10 g CO2e/km | ~5-15 g CO2e/km (improving with battery recycling) |
| Total Life Cycle Emissions | ~205-330 g CO2e/km | ~90-165 g CO2e/km |
As the table illustrates, while EVs have a higher initial carbon footprint from manufacturing, their significantly lower emissions during the use phase – especially with a clean electricity grid like New Zealand’s – lead to a substantially lower total LCE over their lifetime.
Key Finding:
Studies consistently show that EVs charged with renewable energy can reduce their overall life cycle CO2 emissions by 50% to 70% compared to equivalent conventional petrol vehicles. The cleaner the grid, the greater the emissions advantage.
5. Beyond the Tailpipe: Factors Influencing Vehicle Sustainability
The LCE comparison isn’t static; several dynamic factors continue to shape the sustainability of both vehicle types.
Advancements in Battery Technology and Manufacturing
Battery energy density is increasing, reducing the material requirements per range. Manufacturing processes are becoming more efficient, and efforts to use recycled materials in new batteries are gaining traction, further lowering the initial carbon impact of EVs.
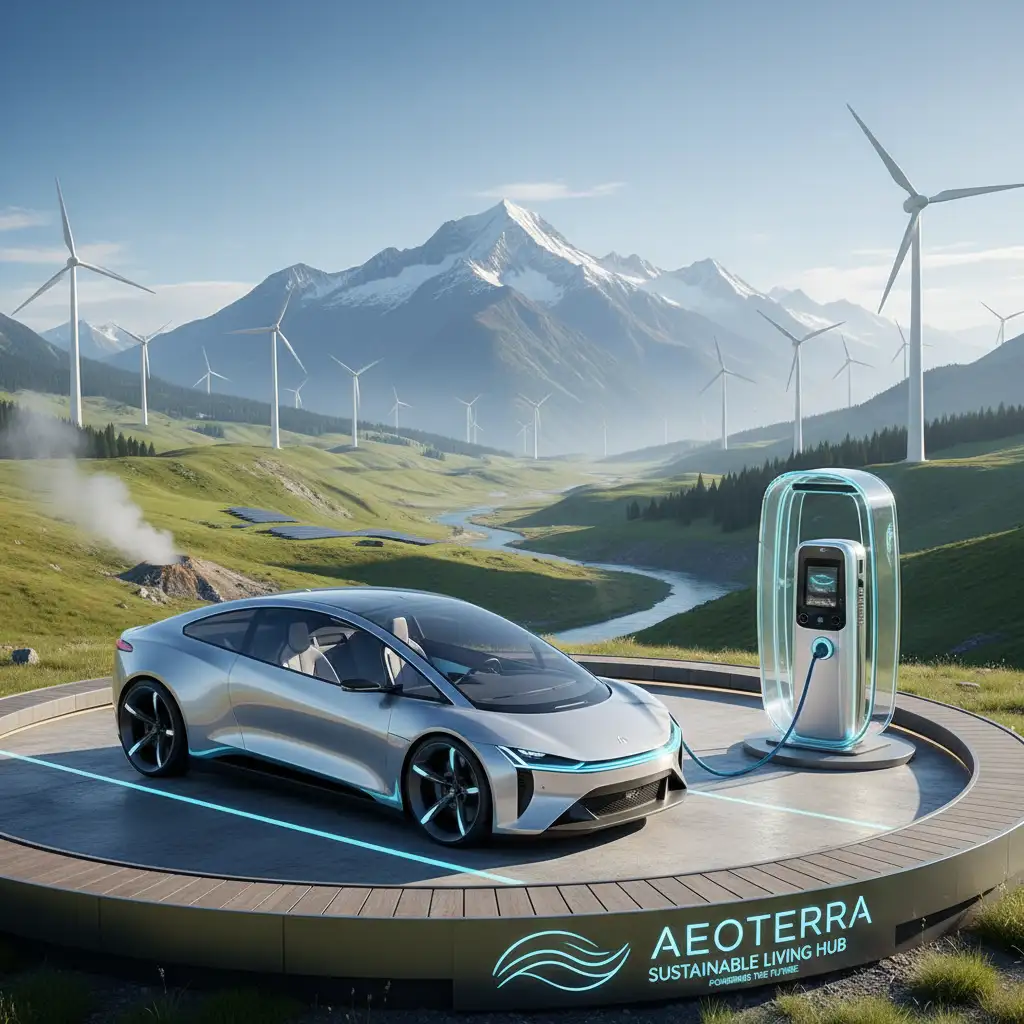
Renewable Energy Grid Integration
As New Zealand and other nations continue to decarbonise their electricity grids, the LCE of EVs will only improve. Charging an EV directly from solar panels at home pushes its use-phase emissions even closer to zero.
Vehicle Size, Type, and Driving Habits
A smaller, lighter vehicle (whether ICE or EV) generally has a lower LCE than a large SUV. Aggressive driving significantly increases fuel or electricity consumption, raising use-phase emissions. Choosing a vehicle that fits your actual needs and adopting eco-driving practices are simple yet effective ways to reduce your footprint.
6. Making Informed Choices for a Greener New Zealand
Understanding life cycle emissions empowers us to make more responsible transport decisions. For New Zealanders, this means considering:
- Prioritise Needs Over Wants: Do you truly need a large vehicle, or could a smaller, more efficient one suffice?
- Embrace EVs: Given New Zealand’s clean grid, an EV offers a significantly lower lifetime carbon footprint compared to an ICE vehicle.
- Consider Second-Hand: Buying a used vehicle, whether ICE or EV, extends its useful life and defers the manufacturing emissions of a new one.
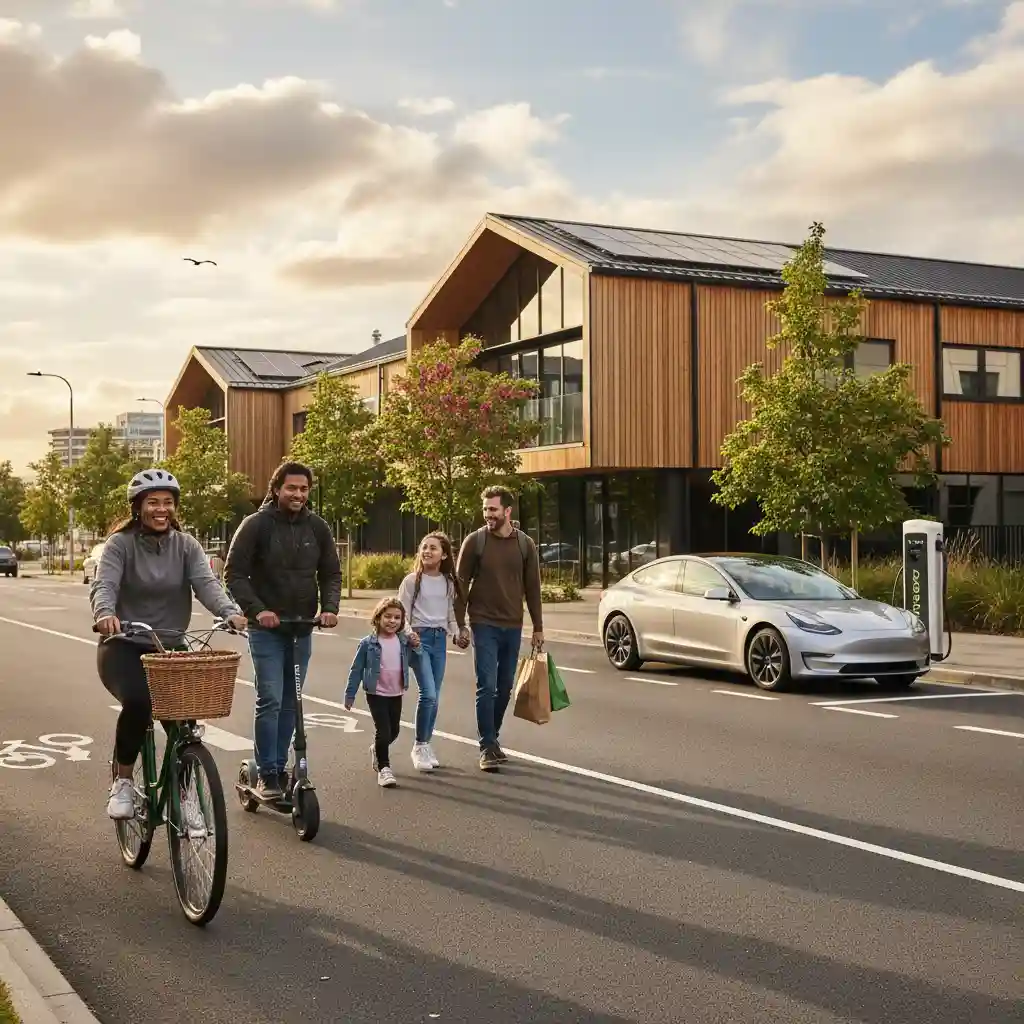
- Combine with Active Transport: For shorter trips, walking or cycling produces zero emissions and offers health benefits.
- Support Public Transport: Utilising buses, trains, and ferries can significantly reduce individual car reliance and associated emissions.
“The most sustainable vehicle is often the one you already own, or the one you don’t buy at all. When a new purchase is necessary, choosing wisely across the entire life cycle is key.”
Frequently Asked Questions
Are electric vehicles truly ‘zero emission’?
No, EVs are not entirely ‘zero emission’ when considering their full life cycle. While they produce no tailpipe emissions, there are emissions associated with manufacturing (especially batteries), electricity generation (depending on the grid mix), and end-of-life processing. However, when charged with renewable energy (as is largely the case in New Zealand), their overall life cycle emissions are significantly lower than conventional petrol cars.
How much higher are an EV’s manufacturing emissions compared to a petrol car?
The manufacturing emissions of an EV can be 30% to 70% higher than a comparable petrol car, primarily due to the energy and materials required for battery production. However, this initial deficit is typically ‘paid back’ within 1.5 to 3 years of driving, especially when charged on a clean grid, leading to lower overall lifetime emissions.
What happens to EV batteries at the end of their life?
At the end of their automotive life, EV batteries can often be repurposed for ‘second-life’ applications, such as stationary energy storage for homes or grid support. Once they can no longer hold sufficient charge for these uses, they are increasingly recycled to recover valuable materials like lithium, cobalt, and nickel, reducing the need for new mining and minimising waste.
Does the size of a vehicle affect its life cycle emissions?
Yes, absolutely. Larger and heavier vehicles, whether conventional or electric, generally require more materials for manufacturing and more energy to move. This leads to higher emissions across all life cycle stages compared to smaller, lighter vehicles. Choosing a vehicle size appropriate for your needs is a crucial sustainability factor.
References/Sources
- International Energy Agency (IEA). (2023). Global EV Outlook 2023. Retrieved from IEA Website.
- Ministry for the Environment. (2022). New Zealand’s Greenhouse Gas Inventory 1990–2021. Retrieved from Ministry for the Environment Website.
- European Environment Agency (EEA). (2021). Are electric vehicles really better for the climate? Retrieved from EEA Website.
- Transport and Environment (T&E). (2020). How clean are electric cars? Retrieved from Transport and Environment Website.
- Argonne National Laboratory. (Ongoing). GREET Model (Greenhouse gases, Regulated Emissions, and Energy use in Technologies). Retrieved from Argonne GREET Website.